Pearson vs. Spearman Correlation Coefficients

One of the misuses of statistical terminology that annoys me most is the use of the word “correlation” to describe any variable that increases as another variable increases. This monotonic trend seems worth looking for, but it plainly is not what most people discover when they use standard correlation coefficients. This is because the Pearson product moment correlation coefficient, which is usually the only correlation coefficient students learn to calculate, is strongly biased towards linear trends: those in which a variable y is a noisy linear function of a variable x. Only the Spearman correlation coefficient, which is usually not taught to students, actually detects a general monotonic trend. You can see this for yourself easily by seeing what the correlation coefficient is between x and progressively higher-degree polynomials in x.

Pearson vs Spearman.png

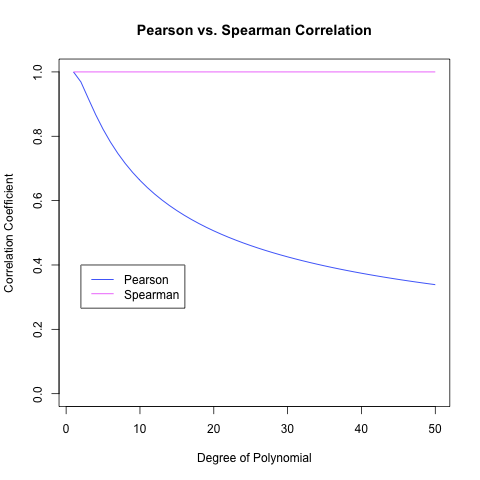
If the Pearson correlation coefficient actually detected monotonic trends, it wouldn’t plunge to zero as the degree of the polynomial in x increases. This is precisely what the Spearman correlation coefficient does.

I hope that we can reconcile our intuitive thinking and our statistical practice by ending the self-contradiction in which the word “correlation” is used in discourse to describe the behavior of an ideal Spearman correlation coefficient, while in practice correlations are computed using Pearson’s formula.

11 responses to “Pearson vs. Spearman Correlation Coefficients”

  1. quinn

    when is it more appropriate to use pearson instead of spearman, or vice versa?
    i am trying to figure out an online stats assignment and this is not clear to me at all.

    thanks

  2. Stat Learner

    I heared that, “If the data are not normally distributed one can use Spearman correlation coefficient.” Do you agree to this statement?

  3. Rafael Rey

    What does the number 6 that appears in the formula for Spearman’s Rho?

    thank you very much.

  4. Lenka

    The formula for Spearman is similar as for Pearson, just using the ranks of the observations instead of theirs values.
    The formula with 6 in it is an easier way how to get the same result – it is just a different form of the same prescription, co no worries about the six.

  5. angela

    i just want to know that when the same scores are converted into ranks, can it produce different correlations? As in one calculation, the answer of pearson correlation was +.004 and when it was converted into rank, the spearman correlation was -.10. Is this possible and why?
    thanx

  6. jen

    hi John, i found yr explaantion very helpful i wonder if u know where I can find this justification for spearman in academic journals?

    i need to quote such references for my thesis.

    my study is btw stigma and communication ard mental illness so it’s not a simple linear relationship i’m sure so i think spearmans the one for me.

    i wil look ard too, but jus thot to ask if u knew any offhand.thanks!
    - jen

  7. Matias

    Very good forum, so … my question now is. It is correct to say “there is a correletion between the variable X and variable Y” —–> if i had a significative Rho of a spearman ?¿. Or which would be the best way to present my results in a conference.

    Thank you very much !

  8. Ajay

    Hi JOhn, thanks for explanation above. Hope you can help me with below:-

    What would be the best to identify correlation between sales of brands available in supermarkets?
    Note:- I don’t have transaction data, just the total sales in a given week for two years. I am planning to time series analysis to find out correlation between brand hitting peaks at the same time and brands getting affected by it. Planning to Pearson first and then Spearman or Kindall later once the ranking is defined. Any thoughts on this would be much appreciated.

  9. Suz

    Jen,
    Did you have any luck? I’m trying to find this too.
    Suz

Leave a Reply