Introduction Link to heading
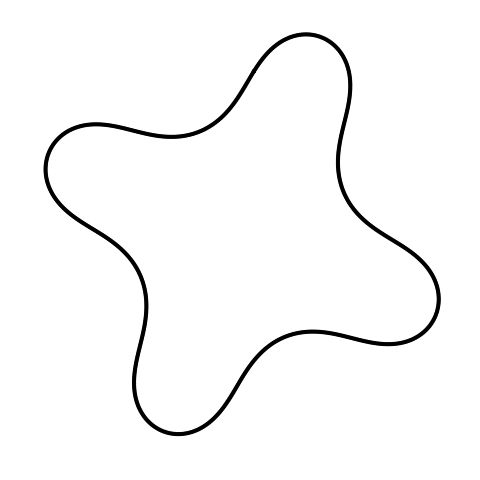
I’ve just uploaded a new package to CRAN based on a stimulus generation algorithm that I use for my experiments on vision. The FourierDescriptors package provides methods for creating, manipulating and visualizing Fourier descriptors, which are a representational scheme used to describe closed planar contours. The canonical reference from the literature is Zahn and Roskies 1972. The images most easily described using Fourier descriptors are useful as stimuli for experiments in psychology and neuroscience.
Installation Link to heading
This package has been submitted to CRAN. When it propagates through the mirrors, you can install it using a simple call to install.packages():
install.packages('FourierDescriptors')
For the time being, please install it using the included source package by downloading the GitHub repository and running:
R CMD INSTALL FourierDescriptors_*.tar.gz
Basic Usage Example Link to heading
The following example showcases the central methods that currently exist in the FourierDescriptors package:
library('FourierDescriptors')

fd1 <- create.fourier.descriptor()
print(fd1)
plot(fd1)

fd2 <- random.fourier.descriptor(32, 2)
plot(fd2)
Gaining Intuition about the Amplitude Spectrum Link to heading
It’s useful to see the images generated by very basic amplitude spectra to see how these determine the shape of the induced contour.
library('FourierDescriptors')
plot(create.fourier.descriptor(amplitude = c(0, 0, 0, 0)))

plot(create.fourier.descriptor(amplitude = c(0, 1, 0, 0)))

plot(create.fourier.descriptor(amplitude = c(0, 0, 0, 1)))
plot(create.fourier.descriptor(amplitude = c(0, 1, 0, 1)))

plot(
    random.fourier.descriptor(
        24,
        non.zero.frequencies = 4,
        generating.function = function() {runif(1)}
    ),
    steps = 360 * 10
)
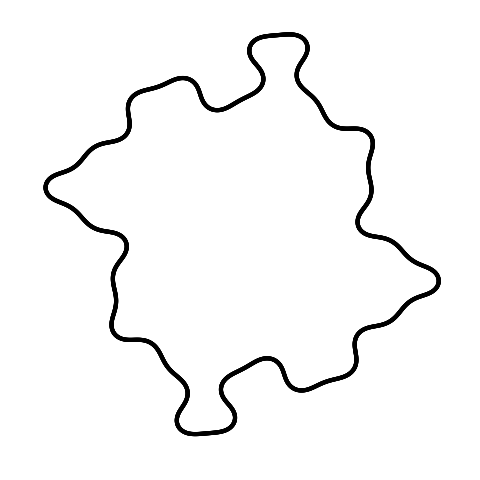
Please note that only even-numbered frequencies can have non-zero amplitudes or the described curve will not be closed.